5.10. Analytics Dashboard
Overview
General Filters
Starting with - starting date for reports
Show by - period starting from the Starting with date during which the data will be processed
Display currency - currency used in reports
Tx type - transaction type used in reports. For example: sale, transfer, etc.
Status - transaction type used in reports
Criteria
Dashboard Panels
Customer Lifetime Value (Periodic Percent Active Users)
Overview
Customer Lifetime Value (CLV) is a per-customer metric that represents the total monetary value generated by a customer over a selected time period
Filters
Grouping type - specifies how metrics are aggregated and displayed in the reports. All calculations are performed independently for each group under the same filters and time range. Possible values: Manager, Merchant, Endpoint
Total cost of marketing campaign - defines the total marketing spend for the selected filters and period
Customer Lifetime Value Graph
Customer Lifetime Value (CLV) is a per-customer metric that represents the total monetary value generated by a customer over a selected time period
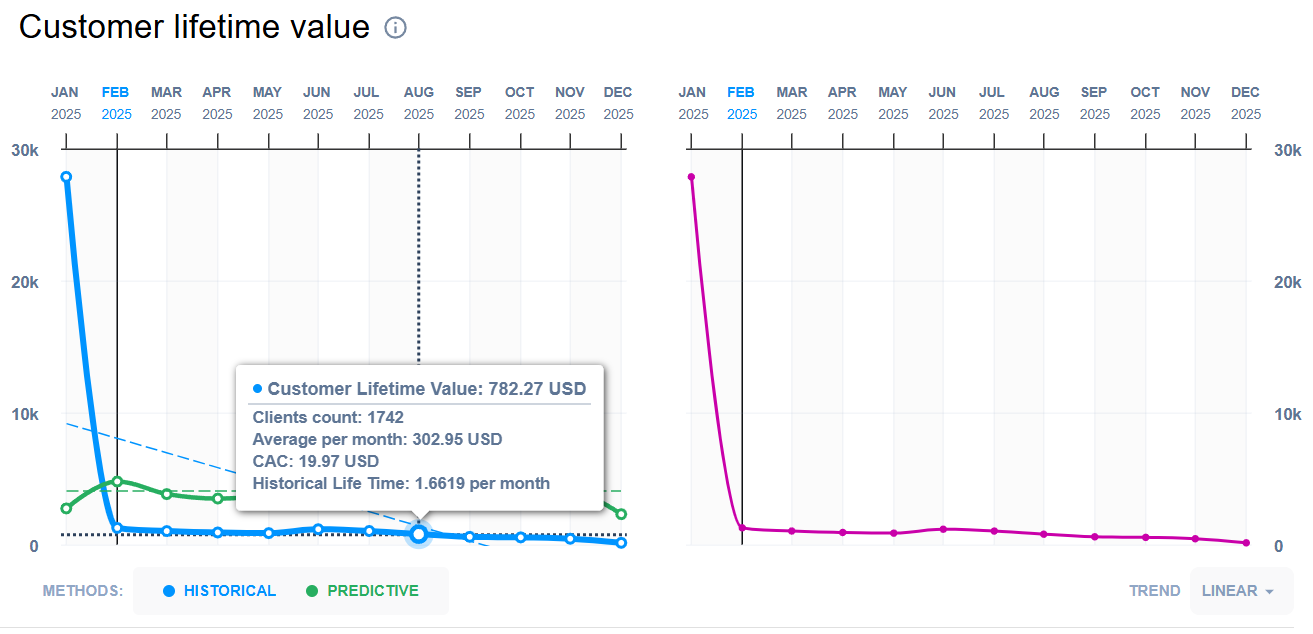
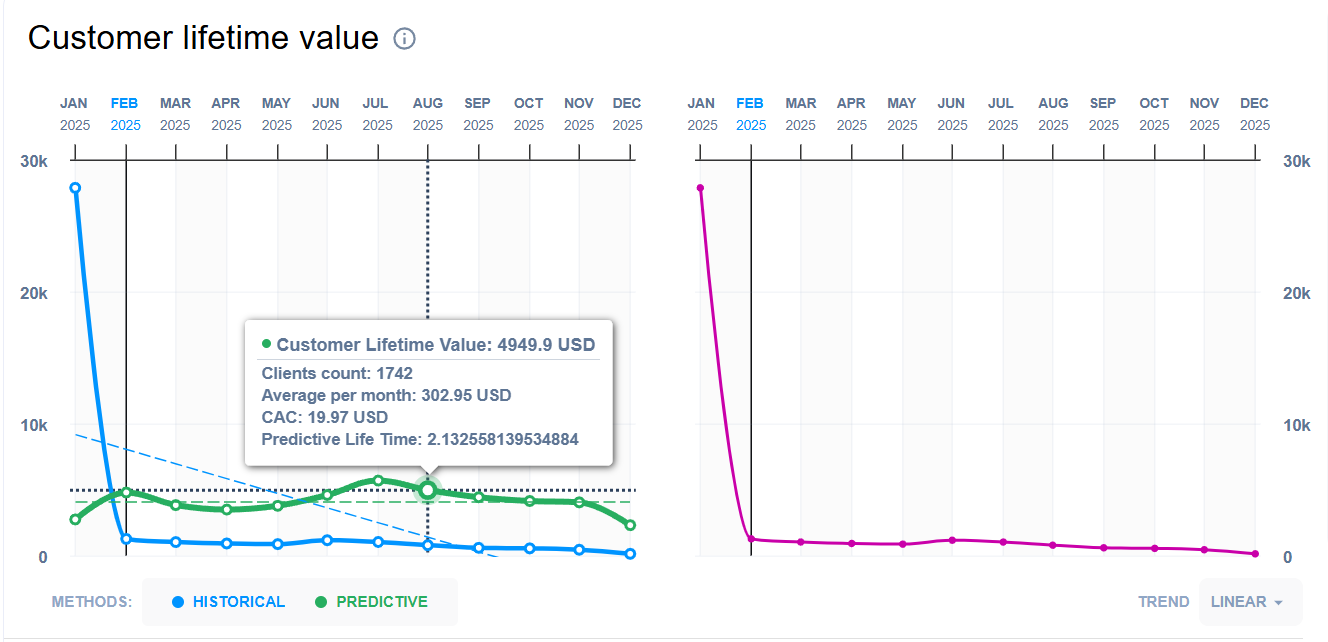
Customer Lifetime Value
Customer Lifetime Value (CLV) is the average total value of transactions generated by a payer over the selected period, expressed in the selected reporting currency.
Calculations:
For each payer, CLV is calculated as the sum of all selected transactions, converted to the selected in filters currency:
where \(N\) is the number of selected transactions for the payer
For each payer determines the month of their first selected transaction
Each payer CLV groups by first month of selected transactions
For each month \(p\), the CLV value is the rounded average of \(Payer\_CLV\) across all payers whose first transaction month equals \(p\):
where \(N_p\) is the number of all Payer CLV, where the first month’s value is the same as the selected month
Average CLV per month
Average CLV per Month represents the average transaction value generated per payer per active month within the selected period, expressed in the selected reporting currency.
Calculations:
For each payer, CLV is calculated as the sum of all selected transactions, converted to the selected in filters currency:
where \(N\) is the number of selected transactions for the payer
For each payer determines the month of their first and last selected transaction
Each payer CLV groups by first month of selected transactions
For each month \(p\), the average CLV per month value calculates as rounded average of \(Payer\_CLV\) across all payers whose first transaction month equals \(p\) divided by the difference between the first and last month:
where \(N_p\) is the number of all Payer CLV, where the first month’s value is the same as the selected month
Clients count
Client count is the number of all unique payers for the period defined in general filters
Customer Acquisition Cost
Customer Acquisition Cost (CAC) is the average marketing spend required to acquire one payer within the selected period.
Calculations:
where \(total\_marketing\_cost\) is the defined in CLV filters total cost of marketing campaign, and \(total\_payers\) is the number of all unique payers for the period defined in general filters
Average Lifetime
Average Lifetime represents the average number of months a payer remains active, calculated for payers that match the selected grouping criteria (e.g., merchant, manager, or endpoint). A payer is considered active from the month of their first selected transaction through the month of their last selected transaction
Calculations:
For each payer determines the month of their first and last selected transaction
Each payer groups by first month of selected transactions
For a payer \(i\) in cohort month \(p\) (where \(first\_month_i = p\)), lifetime is calculated as:
Average Lifetime for specific month (\(p\)) calculates as rounded average lifetimes across all payers in that cohort:
where \(N_p\) is the number of payers whose first month’s value is the same as the selected month
Historical Lifetime
Historical Lifetime is the Average Lifetime for all available groups (by grouping type) defined in CLV filters
Predictive Lifetime
Predictive Lifetime estimates the expected number of months a client will remain active based on the observed month-over-month retention rate
Calculations:
Total active clients in current and previous months is number of clients which was active in previous month and still active in current month
where \(N_p\) is the number of clients considered for period \(p\)
Retention Rate is the share of clients from the previous month who remain active in the current month
where \(previous\_month\_clients_p\) is the total number of active clients in month \(p-1\) for the selected cohort and filters.
Predictive Lifetime for specific period calculates as follows:
Predictive CLV
Predictive Lifetime estimates the expected average Customer Lifetime Value for a client in period \(p\) based on the Predictive Lifetime, Average Order Value and average transactions frequency
Calculations:
Computes the average number or transactions per period:
where \(N_t\) is the total number of selected transactions, and \(N_p\) is number of periods
For period \(p\), Predictive CLV is calculated as:
where \(total\_clients\_in\_previous\_month_p\) is number of unique clients in month \(p-1\), \(AOV_p\) is average order value for specified period
Average Order Value Graph
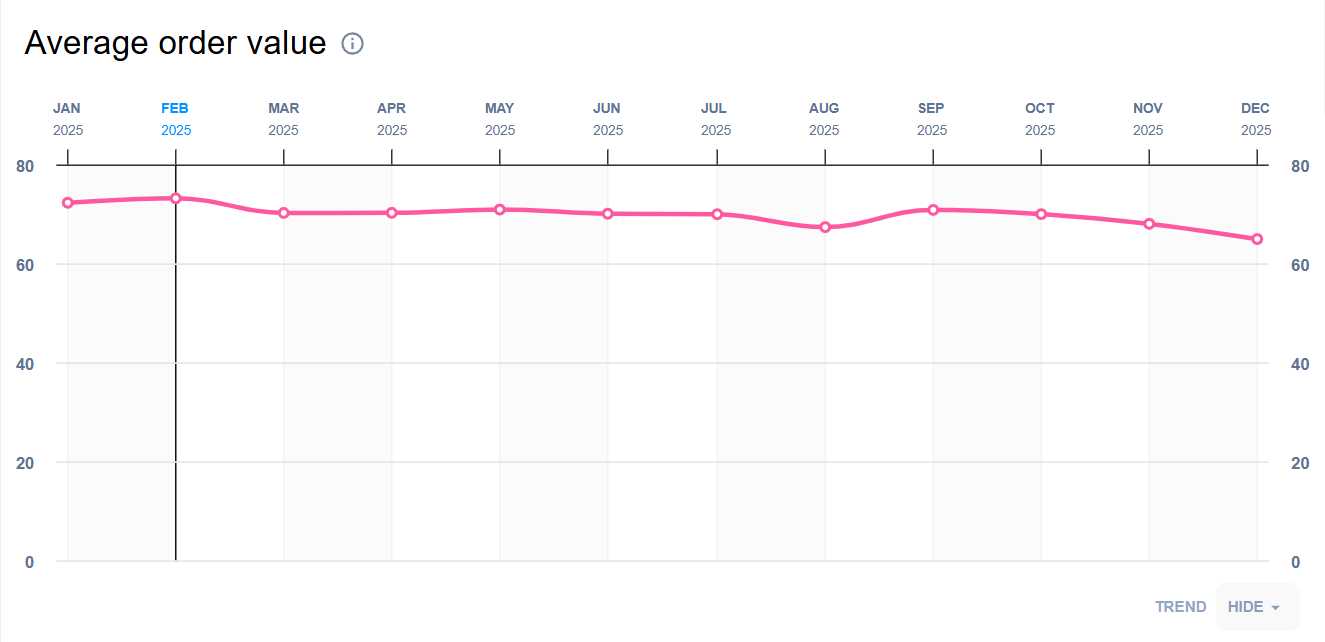
Average Order Value (AOV) is the average transaction amount for a specific period, expressed in the selected reporting currency.
Calculations:
Average order value for specific period \(p\) calculates as rounded average of all transactions, converted to the selected in filters currency, for this period:
where \(N_p\) - is the number of all transactions for the period \(p\)
Average Time to Second Order Graph
Average time to second order - average time between first and second orders
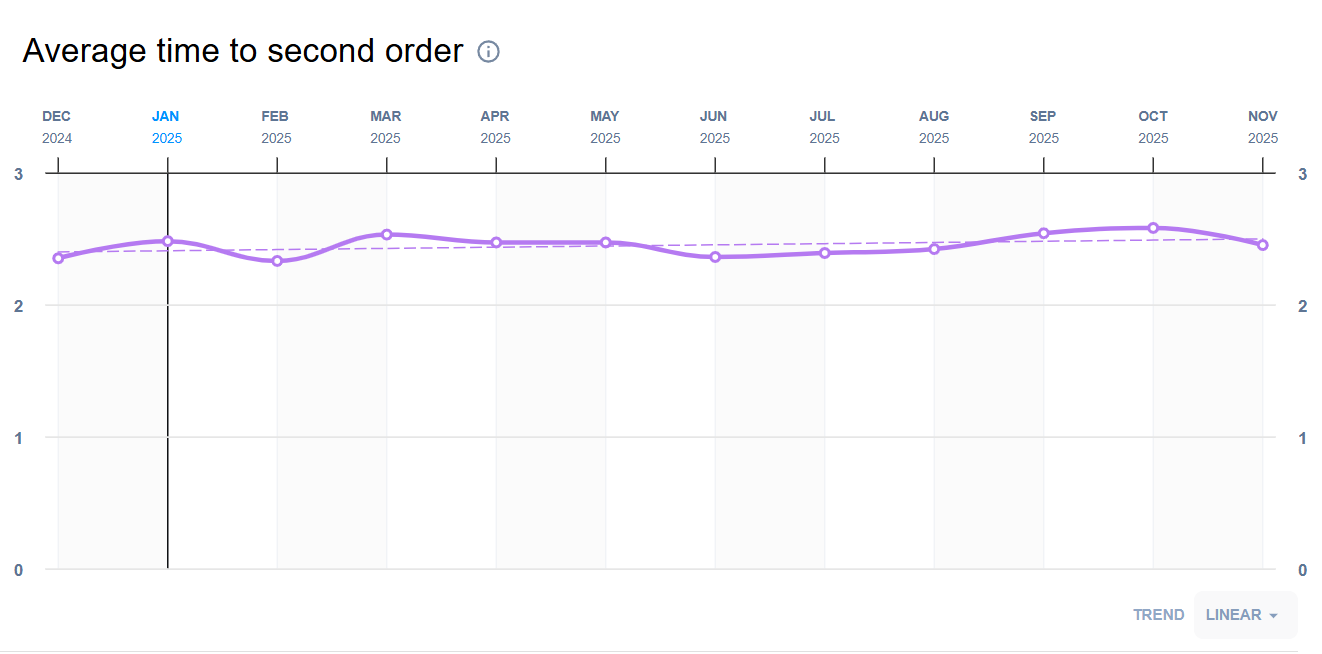
Calculations:
Finds out transactions related to each payer (differentiated by card PAN) for the specified period of time:
\(pan_1\) - \(T_1, T_2, T_3...T_i\)
\(pan_2\) - \(T_1, T_2, T_3...T_i\)
…
where \(T_1, T_2, T_3...T_i\) - date and time when the payer with \(pan_1\) made payment
For each payer calculates the number of days between first (\(T_1\)) and second (\(T_2\)) transactions:
ATSO for specific period calculates as rounded average of date diff for all payers for this period:
where \(N_p\) - is the number of all collected date_diffs for period (\(p\))
Average Time to Next Order Graph
Average time to next order - average time between orders
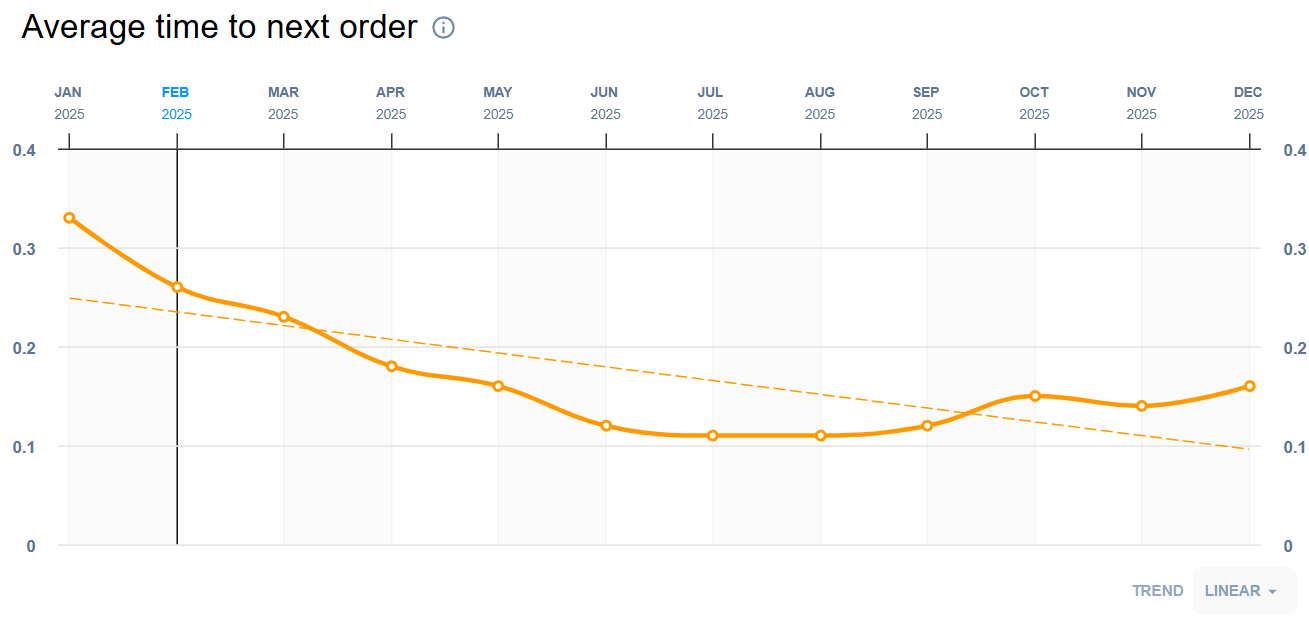
Calculations:
Finds out transactions related to each payer (differentiated by card PAN) for the specified period of time:
\(pan_1\) - \(T_1, T_2, T_3...T_i\)
\(pan_2\) - \(T_1, T_2, T_3...T_i\)
…
where \(T_1, T_2, T_3...T_i\) - date and time when the payer with \(pan_1\) made payment
For each \(T_k\) finds a previous transaction made by the same payer and calculates the number of days between them:
ATNO for specific period calculates as rounded average of all date diffs for all payers for this period:
where \(N_p\) - is the number of all payers for period (\(p\)), and \(N_{pan_i}\) - is the number of all date diffs for specific payer
Return on Investment Bar Chart
Return on Investment (ROI) expresses the relative return generated per acquired payer, measured against Customer Acquisition Cost (CAC). Values are reported as percentages
Calculations:
For each period \(p\), ROI is computed from the period CLV value \(CLV_p\) and the corresponding CAC:
Customer Segmentation CLV Based Segment Chart
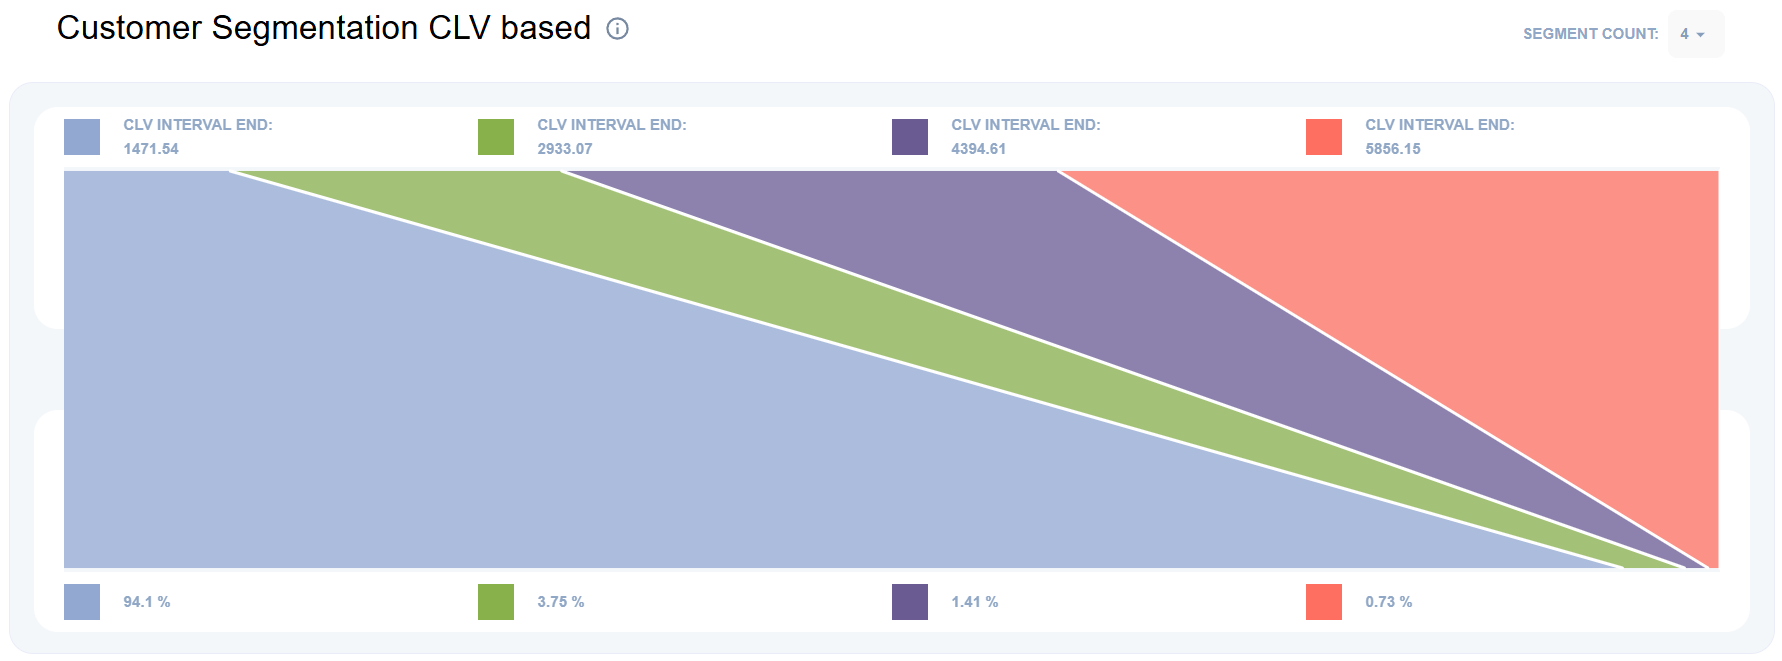
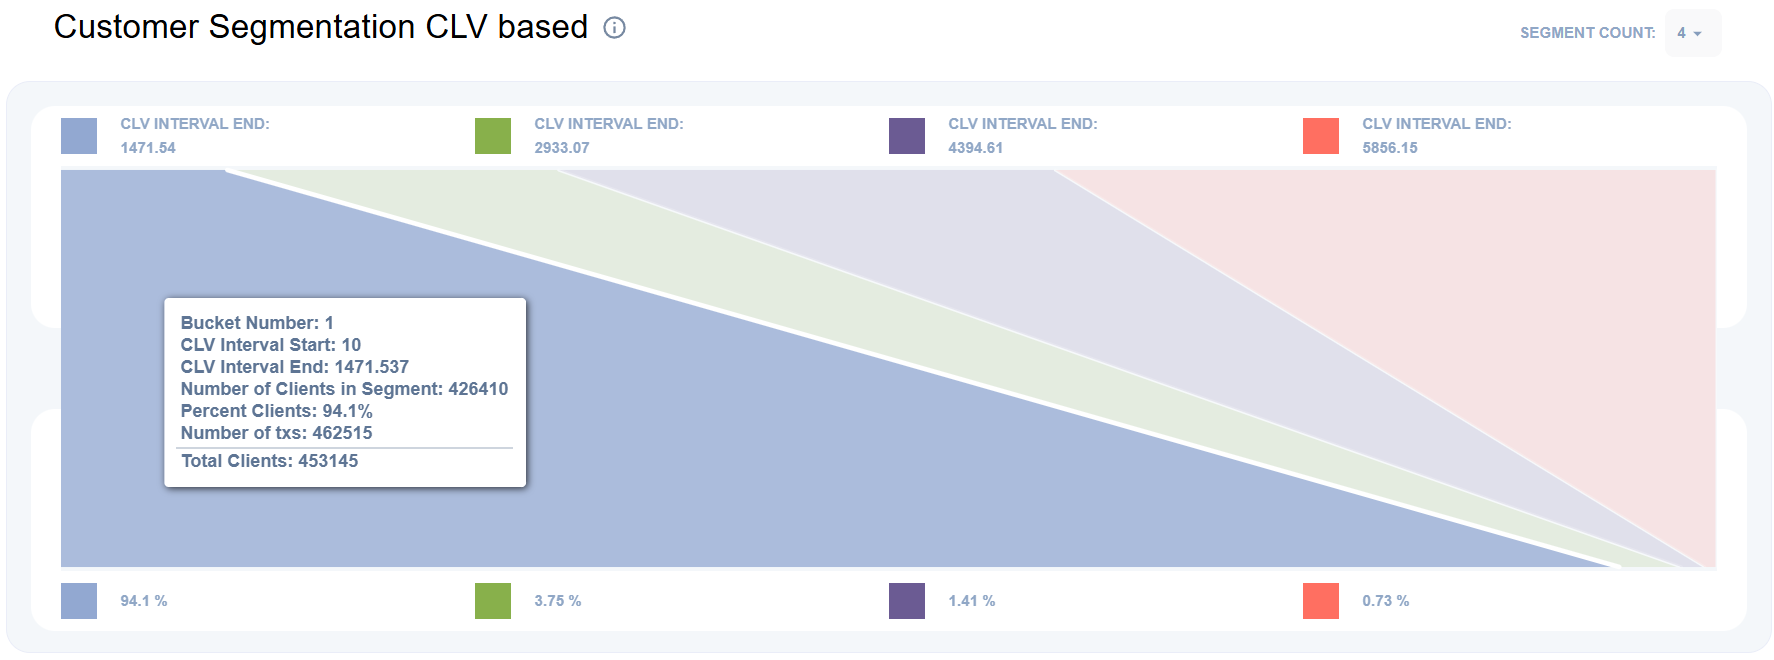
Shows the number of clients in each CLV bucket, providing a distribution of customers by their Customer Lifetime Value (CLV)
CLV bucket is a proportional interval of the CLV range used for segmentation. The bucket boundaries are derived from the robust CLV range between the 2nd and 98th percentiles (\(lmin\) and \(lmax\)) and split into \(bucket\_count\) equal-width intervals (with a minimum bucket width of 1). Each client is assigned to a bucket based on their CLV value
For each payer calculates CLV as sum of all selected transactions:
where \(N\) - number of all payer transactions
Computes bucket bounds (robust range) from CLV distribution:
\(lmin\) = 2nd percentile (0.02 quantile) of all CLV values
\(lmax\) = 98th percentile (0.98 quantile) of all CLV values
Interval calculates as difference between \(lmax\) and \(lmin\) divided by \(bucket\_count\). If obtained value less than 1, interval will be 1:
For each bucket defines its \(interval\_start\) and \(interval\_end\):
where \(i\) - bucket number
Each customer is assigned to a corresponding bucket based on their CLV, after which the number of customers in the ranges of each bucket is calculated.
Percent clients - is the ratio of customers in the current segment to the total number of customers
where \(i\) - bucket number
Top 10 Table
Top 10 entities within the selected grouping type by its CLV
Table shows entity’s name, ROI and CLV growth
where \(CLV_{cur}\) - CLV for current month, and \(CLV_{prev}\) - CLV for previous month
N-month (Retention Curve)
Overview
N-month retention shows the percentage of customers who made at least one payment in the N-th calendar month after their first payment month
Example
If second-month retention is 50%, it means that 50% of customers whose first payment occurred in the first month made at least one payment in the second month
Active clients — customers from the first payment month who made at least one payment in month \(N\). All customers in the first payment month are considered active (by definition)
A customer from the first payment month who made payments in earlier months but did not make a payment in month \(N\) is a Dormant client
A Dormant client who makes a payment in month \(N\) is a Reactivated client.
New clients — customers who made at least one payment in month \(N\) but did not make any payment in the first payment month.
Total clients — the number of unique payers within the period defined in general filters.
First month is defined by the Starting with filter in general filters.
Filters
Grouping type - specifies how metrics are aggregated and displayed in the reports. All calculations are performed independently for each group under the same filters and time range. Possible values: Manager, Merchant, Endpoint
Method - method of indicators calculation:
Periodic - client considered as dormant in the first month if there were no payments.
Retrospective - client considered as dormant after \(churn_period\) months during which there have been no payments
Churn period - filter of retrospective analysis. The number of months that must pass before a client is considered as Dormant
N-month Retention Graph
Periodic
Periodic N-month retention shows the percentage of customers who made at least one payment in the N-th calendar month after their payment in first month
Calculations:
Selects all clients who made at least one payment within the chosen reporting period
For each client, computes \(min\_period\) — the month of the client’s first payment within the selected period. If \(min\_period\) equals the cohort start month, mark the client with the first month purchase flag
Each client who made purchase in specific month \(p\) marks with retention flag for this month
For month \(p\), a client is considered Active if:
client has first month purchase flag
client has retention flag for month \(p\)
if current month is not the first month of cohort period (\(p > cohort\_start\_period\)), client made at least one transaction in previous month \(p-1\)
For month \(p\), a client is considered Reactivated if:
client has first month purchase flag
client has retention flag
if current month is not the first month of cohort period (\(p > cohort\_start\_period\)), client didn’t make transactions in previous month \(p-1\)
Retention for period calculates as follows:
Retrospective
Retrospective N-month retention shows the percentage of customers who made at least one payment in the N-th calendar month or in the \(N-th - churn\_period\_window\) month after their payment in first month
Calculations:
Selects all clients who made at least one payment within the chosen reporting period
For each client, computes \(min\_period\) — the month of the client’s first payment within the selected period. If \(min\_period\) equals the cohort start month, mark the client with the first month purchase flag
Each client who made purchase in current \(p\) month or \(p - churn\_period\_window\) months marks with retention flag for this month
For month \(p\), a client is considered Active if:
client has first month purchase flag
client has retention flag for month \(p\)
if current month is not the first month of cohort period (\(p > cohort\_start\_period\)), client made at least one transaction in previous month \(p-1\)
For month \(p\), a client is considered Reactivated if:
client has first month purchase flag
client has retention flag
if current month is not the first month of cohort period (\(p > cohort\_start\_period\)), client didn’t make transactions in previous month \(p-1\)
Retention for period calculates as follows:
Users Waterfall Chart
Chart shows number of clients per category in selected month \(p\): New, Active, Reactivated, Dormant
Percent on chart is share of clients in specific category in selected month relative to the total number of clients for the whole period
Quick Ratio Graph
Quick Ratio measures growth relative to churn risk. It is defined as the ratio of New and Reactivated clients to Dormant clients for month \(p\).
Calculations:
Average Revenue per User Graph
Average Revenue per User (ARPU) Graph shows average revenue per client by category (New, Active, Reactivated)
Calculations:
For each category \(c\) (New, Active, Reactivated): 1. Counts number of unique clients for specific month \(p\) 2. Counts amount of all transactions for specific month \(p\) 3. Average Revenue per User for specific month (\(p\)) for specific category (\(c\)) calculates as follows:
Total amount - amount of all transactions for specific month
Note
Some clients may not fit into any category. For example New clients from previous month won’t be in any category in current month
Repeat Customer Rate Graph
Repeat customer rate (RCR) - is the share of customers who made two or more transactions during the selected period \(p\).
Calculations:
Counts number of unique customers who made 2 or more transactions for specific period \(p\)
Counts total number of unique customers for specific period \(p\)
Repeat customer rate calculates as follows:
Repeat Customers Rate Count-to-Amount Ratio Bar
Repeat Customers Rate Count-to-Amount Ratio Bar shows correlation of single-purchase customers and their purchases and multi-purchase customers and their purchases for whole selected period of time
The Count-to-Amount Ratio bar chart compares single-purchase and multi-purchase customers across the entire selected period, showing both:
the share of customers in each group
the share of transaction amount generated by each group.
Single-purchase customers - customers with exactly one transaction in the selected period.
Multi-purchase customers - customers with two or more transactions in the selected period.
Calculations:
For each group (single- and multi- purchase customers) counts:
number of unique customers
total transaction amount
Counts total number of customers:
Ratio customers count calculates as follows:
Ratio spent amount calculates as follows:
Top 10 Table
Top 10 entities within the selected grouping type by its Active percent
Table shows entity’s name, Active percent and Active clients growth
where \(Active\_percent_{cur}\) - percent of active clients in current month, and \(Active\_percent_{prev}\) - percent of active clients in previous month